What are usage analytics?
Usage analytics involves collecting and analyzing data on how people interact with a product or service. This data reveals important insights such as which features users engage with most, how long they spend on tasks, and where they face challenges.

Table of contents
These insights allow companies to make informed decisions that improve product usability and enhance the user experience. By tracking user engagement and mapping user journeys, businesses can identify friction points and optimize the product to better meet user needs.
According to PwC, as more companies adopt a data-first approach, usage analytics will become increasingly crucial for decision-making.
Gartner also notes the growing role of data and analytics leaders in shaping business strategy, reflecting the importance of usage analytics in driving growth and user satisfaction.
What are the key components of usage analytics?
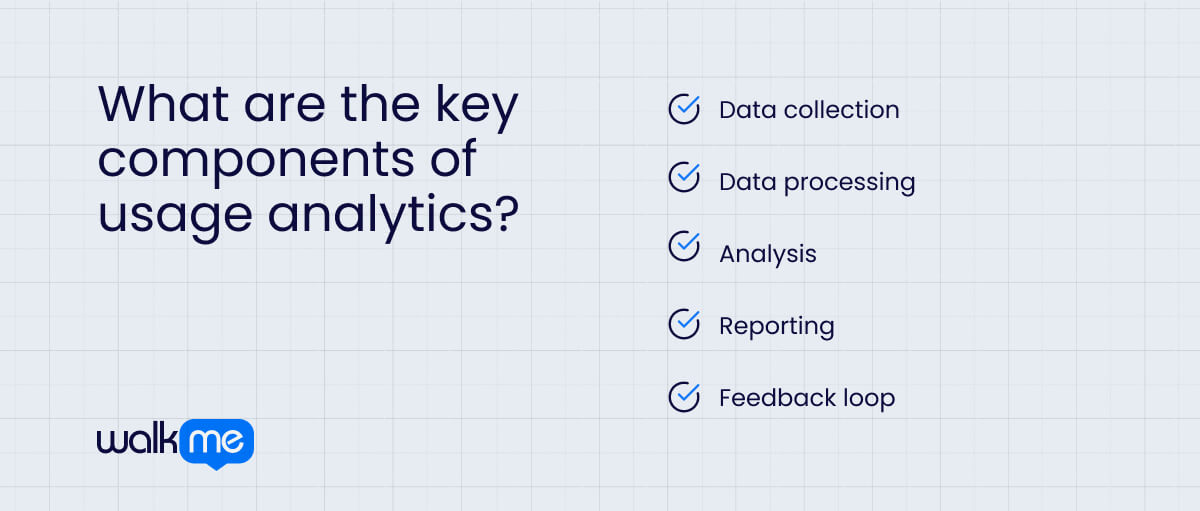
Understanding the main components of usage analytics is key to seeing how it helps businesses make better decisions and improve user experiences.
These components work together to show how users behave and interact with products or services.
By examining these elements, businesses can learn how to enhance features, meet user needs, and increase engagement. Let’s explore the key parts that make usage analytics effective.
Data collection
The first step is to gather information about how users interact with products. Data can include things like clicks on features, time spent on tasks, and user feedback from surveys.
Tools such as Google Analytics, Mixpanel, and Heap automatically collect and store this data in real-time. The more granular the data, the better businesses can understand user behavior.
Data processing
Once the data is collected, it needs to be organized and cleaned. Mistakes, duplicates, or irrelevant information that could affect the results are removed. Organizing the data also involves arranging the information in a way that makes it easy to analyze.
For example, grouping data by user age or most frequently used features ensures that it is ready for accurate analysis. Proper processing ensures that businesses work with reliable insights.
Analysis
After processing, the data is examined to find patterns in user behavior. Metrics such as churn rate, conversion rate, and feature engagement are commonly analyzed.
Advanced techniques like cohort analysis and funnel visualization help uncover deeper insights into user journeys. The goal is to understand what users like and what needs improvement based on their actions.
Reporting
The analysis’s findings are then turned into reports. These reports give valuable insights into user behavior and show what is working well and what needs fixing.
Tools like Power BI or Tableau allow businesses to create custom dashboards that track key performance indicators (KPIs) like session length or engagement rate. These reports are shared with different teams, such as product development or marketing, to inform data-driven decisions.
Feedback loop
The last part involves using insights from usage analytics to make decisions. Businesses can make changes based on what the data shows, such as improving features that are not used much or fixing problems users face.
After changes are made, companies can track how these changes affect user engagement. This ongoing cycle of analyzing, acting, and reassessing helps businesses keep up with changing user needs and improve their products and services.
Usage analytics vs. user analytics
Usage analytics and user analytics both help understand how people use products, but they focus on different things.
- Usage analytics looks at the overall patterns in how a product is used, like which features are popular and how long tasks take.
- User analytics focuses on individual users, collecting information about their behaviors, likes, and backgrounds.
Let’s explore the differences between these two ideas in more detail.
| Usage analytics | User analytics | |
| Definition | Collecting and looking at data on how people use a product or service. It tracks actions like clicks, time spent, and which features people use. | Understanding individual users or groups. It helps learn about the age, habits, and likes of users to create profiles and segments. |
| Focus | Overall usage patterns and actions within the product or service. It helps find popular features and areas that need fixing. | Specific details about users, providing insights into who they are and how they use the product. |
| Techniques | Tracking numbers like page views, session length, and feature clicks. It often uses tools like heatmaps to see where users click most. | Making user profiles, grouping users by behavior, and looking at age and location. It might use surveys and feedback forms to gather more information. |
| Goals | Improve the product by understanding how users interact with it and finding features that help or hurt their experience. | Create better experiences for users by knowing their needs and habits, which helps keep them engaged. |
| Examples of use | A company may use usage analytics to see which app features are most popular and which ones are not used, guiding future updates. | A business might use user analytics to group customers by age, location, and buying habits, allowing for targeted advertising. |
Use cases for usage analytics
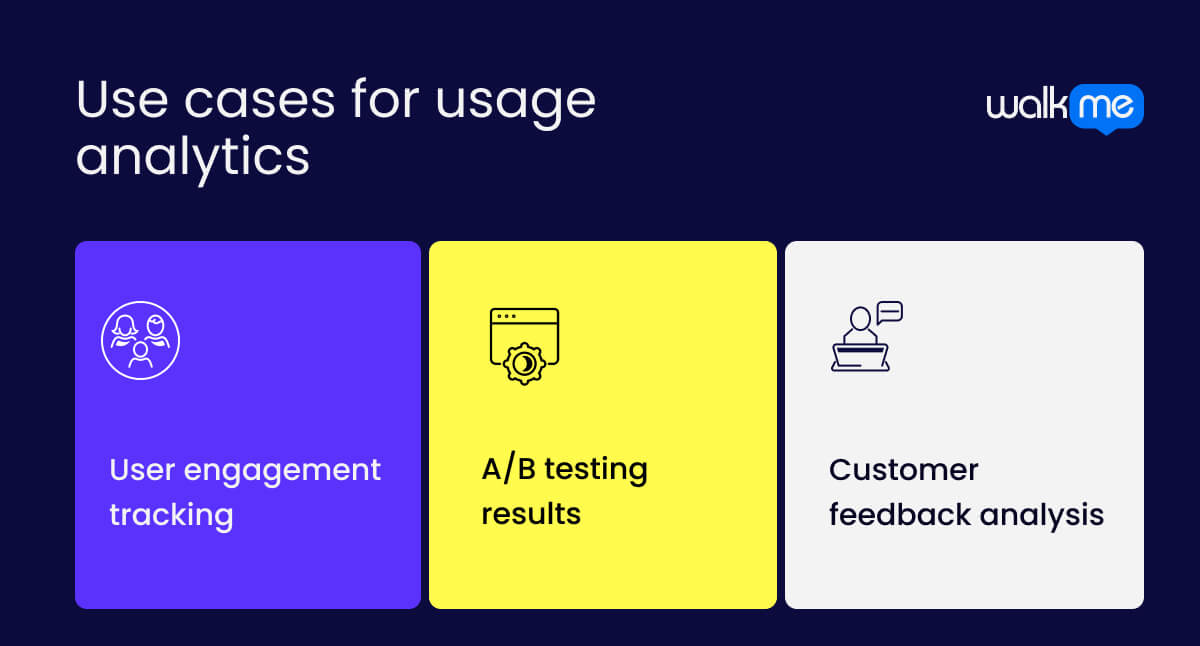
Usage analytics is helpful in different business situations.
It helps product teams see how people use their product, guides marketers in testing new ideas, and helps customer support understand feedback.
It can be hard to picture how usage analytics works, so here are three examples to explain it more clearly.
User engagement tracking
User engagement tracking helps a company see how users interact with their app or website. The system collects data on actions like clicks, time spent on pages, and which features people use automatically.
Reports show which features users like and where they stop using the app. Such information helps the product team understand what works and what needs fixing. The team can quickly change features based on the data, making the experience better for users and keeping them engaged.
A/B testing results
A/B testing results help businesses compare two versions of a product feature. The system randomly shows one version to some users and another version to others, gathering data on how each version performs automatically.
Reports display which version gets better user actions, like clicks or purchases. Insights from these reports help the marketing team decide which version to keep, allowing them to improve their campaigns and boost sales without guessing what users like.
Customer feedback analysis
Customer feedback analysis helps a company understand what users think about its products. The system automatically collects feedback from different sources, such as surveys and reviews.
Reports summarize common comments and issues from users. Such insights help the customer support team identify areas for improvement. Based on the insights, the team can quickly address problems and improve customer satisfaction.
What are the benefits of usage analytics?
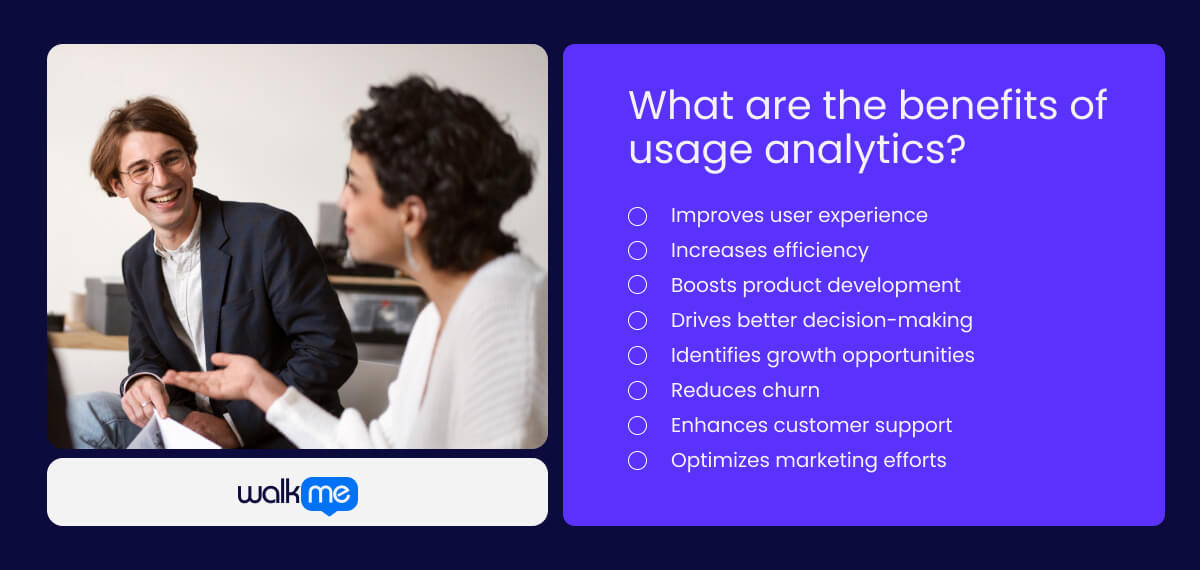
Usage analytics offers numerous benefits for businesses, enabling them to make informed decisions that enhance user experience, boost performance, and increase profits.
Here are the key advantages of incorporating usage analytics into a business strategy.
Improves user experience
Businesses can see how people use their products by looking at which features are popular and where users have problems. With this information, companies can make changes to make the product easier to use and fix what isn’t working well. These updates help keep customers happy and make them more likely to keep using the product.
Increases efficiency
Businesses can easily find which parts of their product don’t work well. Focusing on fixing those parts allows teams to save time and make improvements faster. With clear data, teams work better and make decisions that help improve the product quickly.
Boosts product development
Data shows what users like and don’t like about a product. This helps developers concentrate on making popular features even better and fixing or removing features that aren’t used. Feedback also helps create new features that people need, making the product stronger and more useful over time.
Drives better decision-making
Usage data shows exactly how people are using the product, helping teams make better decisions. Instead of guessing what users need, businesses can use real facts to make smart changes. Making data-driven decisions helps companies implement the right improvements that match what users want.
Identifies growth opportunities
Looking at how users behave can help businesses find new ways to grow. For example, if many users like a certain feature, companies can expand it or promote it more. Spotting these trends leads to the creation of new products or services, keeping companies growing and ahead of the competition.
Reduces churn
When businesses see that a user is not using the product as much or skipping important steps, it can signal that they might leave. By spotting these signs early, companies can act quickly to solve problems and keep customers from leaving. Addressing customer needs helps reduce the number of people who stop using the product.
Enhances customer support
When companies know how users are interacting with the product, they can provide better customer support. Support teams can spot common problems and offer solutions more quickly. Giving advice that matches the user’s needs helps solve issues faster and improves the overall experience for everyone.
Optimizes marketing efforts
Data from usage analytics shows which features or campaigns work best. Marketing teams can use this information to focus on what users like the most, helping them improve their strategies. A targeted approach makes marketing more effective, saves time, and helps bring in more customers.
What are the challenges of usage analytics?
Businesses want to make smart choices that improve user experience by understanding how customers use products. However, several problems arise when gathering and analyzing this data, which need to be considered.
Data privacy
Keeping user data private can be a big challenge. Companies must follow rules about how to collect and use personal information. They must also carefully handle what data they gather and how they store it to protect users’ privacy.
Data accuracy
Getting accurate data can be hard. If tracking tools aren’t set up right or if users turn off tracking, the information collected may not be reliable. Making decisions based on wrong data can lead to poor choices and negative results.
Interpretation difficulties
Figuring out what the data means can be tricky. Analyzing the numbers and finding patterns takes skill and knowledge. Teams might need training to turn the data into useful insights that can help improve things.
Resource demands
Collecting and analyzing usage data can take a lot of time and resources. Businesses may need special staff or tools to manage the data correctly. Smaller companies with tight budgets or fewer workers may struggle to use usage analytics fully.
How can DAPs help with usage analytics?
Digital adoption platforms (DAPs) are important for making usage analytics better. When businesses use a DAP, they can learn more about how users interact with their products. These platforms provide helpful tools that allow companies to see user behavior, track which features are used, and find areas that need improvement.
Knowing how DAPs help with usage analytics can lead to smarter choices and better user experiences. Let’s examine the ways DAPs support and improve usage analytics in different business settings.
Data collection
Gathering important data on how users interact with a product is key to understanding their behavior. DAPs help by tracking user actions in real-time. They capture details about which features are used, how often they are accessed, and the paths users take within the product.
The data helps businesses better understand user behavior, find patterns, and identify areas that need improvement. With accurate information available, companies can make smart choices that improve product features and keep users happy.
Real-time insights
Thanks to DAPs, businesses can see user actions as they happen. They provide immediate feedback on how users interact with the product. Real-time data lets teams respond quickly to what users need and make changes to improve the product.
For example, if a feature isn’t being used much, teams can find out why and make adjustments right away. Having access to real-time insights also helps companies work faster, letting them change their products more easily based on what users want.
Personalized experiences
Using DAPs, companies can create customized experiences based on how users behave and what they like. By looking at the data collected, businesses can spot individual user patterns and show features that matter most to each user.
As a result, users get helpful tips, guidance, or prompts that help them get the most out of the product. Personalization makes users more engaged and happy because they feel that the product is made just for them.
Easy reporting
DAPs make creating reports easier by automatically turning data into easy-to-read summaries and dashboards. These tools eliminate the need for manual data collection, saving teams time and effort.
Simple reporting helps businesses quickly check key metrics and insights that show user behavior trends and areas for improvement. As a result, teams can spend less time on reporting and more time using the information to make smart decisions that improve the product and user experience.