Impact and value analysis are popular themes among WalkMe Program Management professionals. So much so, that the LeaseAccelerator team thought it a perfect topic for the inaugural installment of the DAP Pro Show. In that webinar, I discuss my own experience overcoming what I see as the most common impediments to scalable valuation — documentation and process formalization.
To scale the solutions that drive the most value we use historical data, which helps us model impact. The collection and analysis of that data gives us the information we need to reasonably forecast future outcomes.
Accurate model calculations depend entirely upon predictability, from an operational perspective. So, we focus on documentation and formal (digital) processes, as these are the factors that most facilitate that priority.
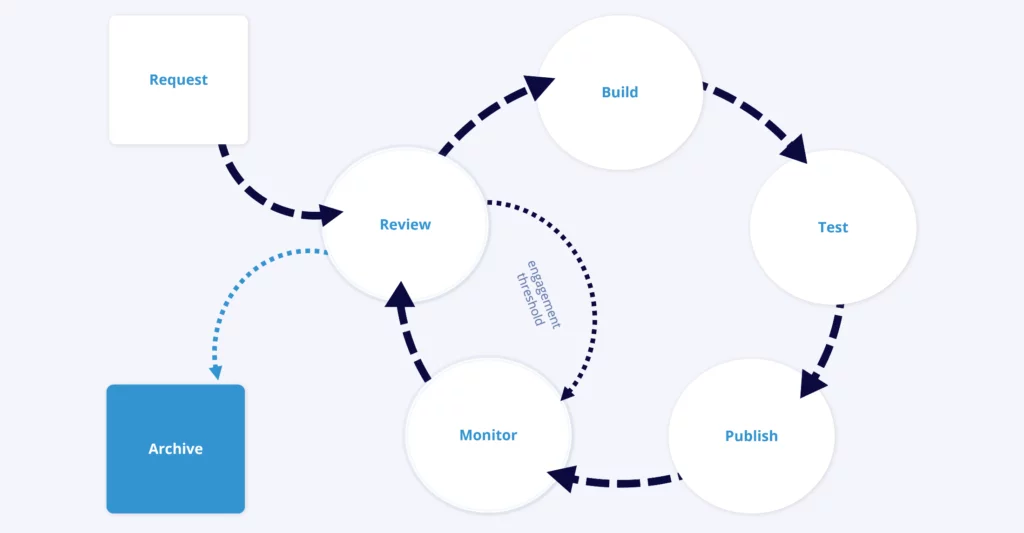
Complexity tends to build itself but simplifying touchpoints will help limit confusion and promote engagement. For that reason, we try to keep our process milestones succinct and cyclical, as you can see in the below graphic.

Throughout this post, I’ll breakdown these steps to better illustrate what each stage entails , hopefully making the “process” a little bit more concrete. Who knows? Maybe you’ll be inspired to create scalable, repeatable processes and documentation in your own program.
Let’s start with an example.
- Process Trigger – Request
Action: A content creation request is submitted (associated process automation)
Context: We’re a SaaS accounting platform that provides lease management, reporting, and lifecycle automation. According to our Support team, when users enter special characters in their Lease Schedule numbers (a user input field in our software), the effects on our reporting engine are catastrophic.
- Process Step – Review
Action: Read through the details provided by the requestor and collect answers to open questions.
Context: In this scenario, we wanted to know how those tickets are currently classified. We also discussed impact both on the Customer and the Support team.
- Process Steps – Build | Test | Publish
Action: Evaluate the needs identified in the review step and design a solution that maximizes value.
Context: Since we understand the nature of the problem, we can safely assume that modifying this behavior will prevent several high priority support tickets and decrease the overall workload on our support team.

Solution: Alex Alert
These are guardrails that provide warnings and/or guidance as customers interact with our application. We build them using a variety of deployables from SmartTips and Launchers, to Smart Walk-thrus. They may function as a standalone notification, or in combination with other resources, depending on the behavior we want to promote.
In this case, a user is being educated as to the use of special characters in the definition of their Lease Schedule #.
Alex provides the list of unacceptable characters in the alert, so the user has all the information they need to adjust appropriately.
- Process Step – Monitor
Action: Compare baseline data to performance post-deployment.
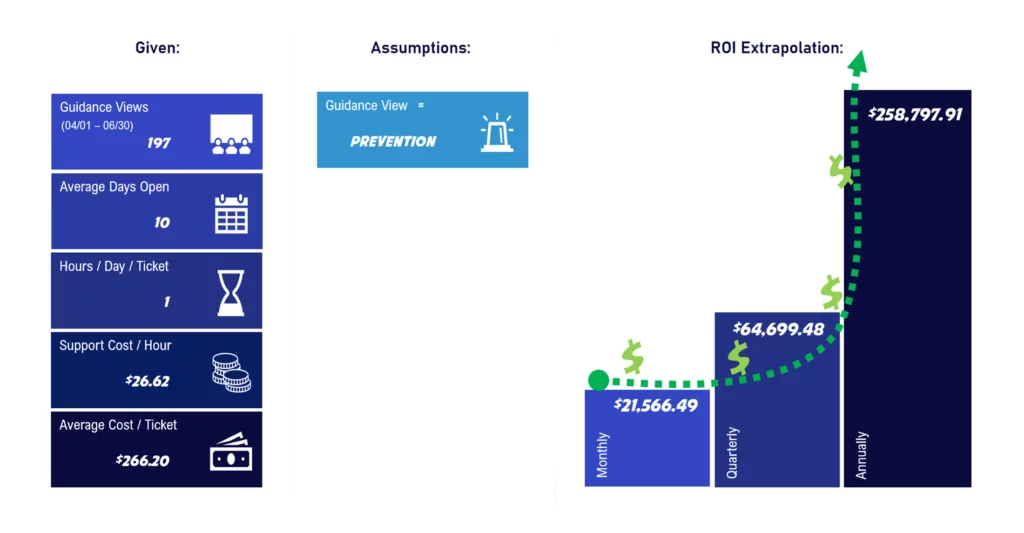
Context: This Alex Alert was evaluated (Validation SmartTips check against parameters defined in the Rules Engine to determine this number) 6690 times between 04/01/2022 – 06/30/2022.
Of those evaluations, 197 users triggered the pop-up.
In our initial review step, we collected ticket data related to special characters in Schedule Number definitions. Now we can predict annual value.

- Process Step – Review/Monitor cycle
Demo 1 – Maintenance Dashboard – incorporates thresholds for quick review
Action: Given the nature of a SaaS platform, we can proactively anticipate whether our product team intends to incorporate functionality that meets the need addressed by our solution, so we review product release roadmaps for native improvements and monitor performance at regular intervals
Context: Our formal process includes engagement thresholds (limits are specific and relative to maintenance complexity).
If a solution doesn’t meet engagement requirements (i.e., 20 or more interactions), and maintenance is necessary, then its ROI data is re-evaluated by the experience team. The solution may be retired until such time as it becomes either more valuable or easier to maintain.
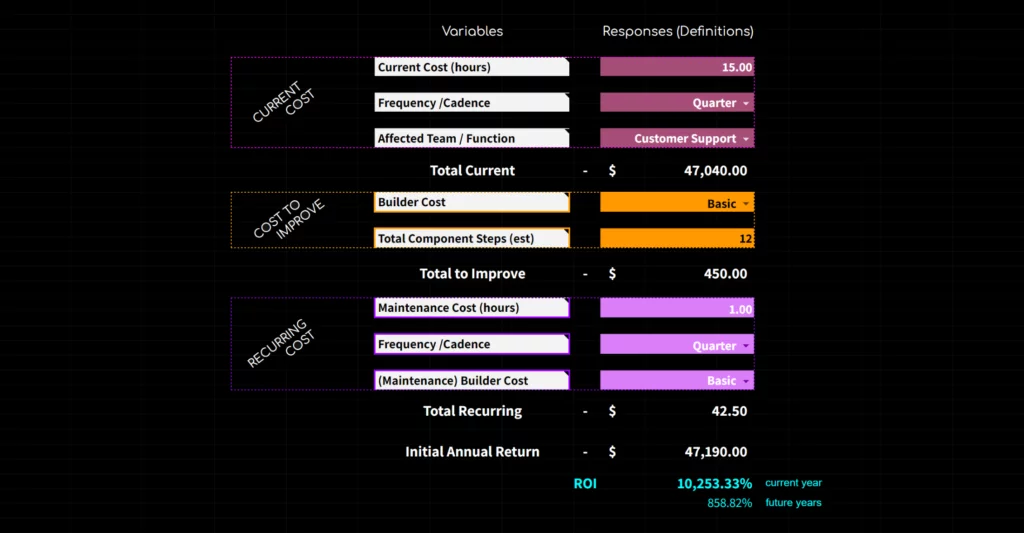
In an effort to further facilitate the conversation for y’all, I built an ROI calculator in Google Sheets. Plug in the numbers and it’ll calculate the current and future ROI based on the definitions provided on the ROI List Components sheet.

This screenshot is based on the example we’ve discussed here. It incorporates the average hourly cost of a resource (Customer Support). The calculator combines that with the resolution rate to extrapolate the Current Cost (hours/day) per ticket. It incorporates the Cost to Improve amount and takes it one step further by accounting for the Cost to Maintain.
We build this data into the process and document each step making it easy to communicate the value of the tool and, by extension, the team. And when it’s time to show our work, we plug in the numbers and let the math tell the story.


