What is adoption rate?
The adoption rate measures how many people begin using a new product, service, or technology after its launch. It is an important metric for businesses to understand how well their new offerings are being received by customers.

Table of contents
The adoption rate is calculated using the following formula:
- Adoption Rate = (Number of New Users / Total Target Users) × 100
A high adoption rate indicates that users find the product valuable and easy to use, suggesting it meets their needs. In contrast, a low adoption rate may signal issues such as a lack of awareness or usability challenges, which can hinder the product’s success.
Adoption rates can vary across different products. For instance, technology products like apps or gadgets may achieve higher adoption rates quickly due to their innovative nature, while more traditional products may experience slower adoption as consumers take longer to make purchasing decisions.
Tracking adoption rates over time allows businesses to refine their products and marketing strategies. By monitoring these rates, companies can better align their offerings with customer needs and improve their overall market success.
What are the key components of the adoption rate?
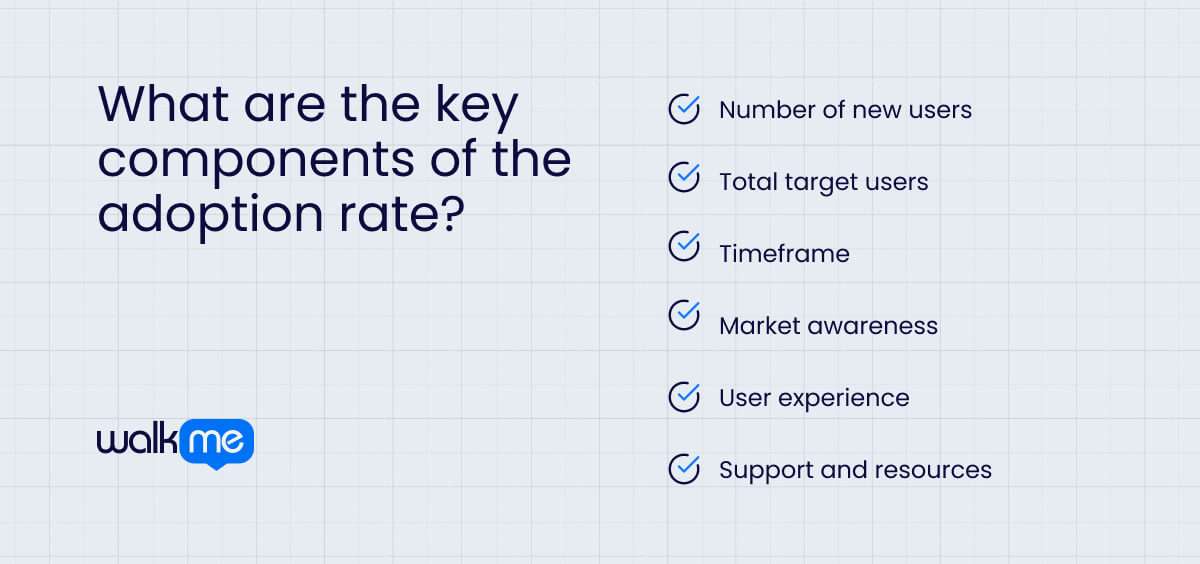
Understanding the key components of the adoption rate is essential for evaluating how well a new product or service is accepted by users.
These factors work together to illustrate user behavior and the effectiveness of marketing efforts, helping businesses identify strengths and areas for improvement.
Below are the key components that influence the adoption rate and their impact on overall success.
Number of new users
This refers to the total number of individuals who begin using a product or service after its launch. Tracking new users helps businesses assess whether the product resonates with the target audience.
A higher number of new users suggests the product is appealing and meeting expectations, while a lower number may indicate gaps in product features, marketing, or user engagement strategies.
Total target users
The total target users represent the potential market size for the product. By understanding the number of users who could benefit from the product, businesses can gauge market penetration.
This component is critical for shaping marketing strategies and ensuring efforts are directed toward the right audience. A clear understanding of the target market enables businesses to tailor their campaigns and maximize adoption.
Timeframe
The timeframe refers to the period over which the adoption rate is measured. Businesses may assess adoption over specific intervals, such as the first month, quarter, or year post-launch.
Short-term measurements can reveal early user engagement, while long-term assessments help businesses understand product retention and sustained growth. This insight guides product updates and marketing adjustments to drive continued user interest.
Market awareness
Market awareness measures how well potential users know about the product. This metric emphasizes the importance of marketing in driving user engagement.
Effective marketing strategies—such as targeted advertisements, social media campaigns, and public relations efforts—are crucial for increasing product visibility. High market awareness increases the likelihood of adoption, while low awareness often signals the need for improved outreach.
User experience
User experience refers to how easy and enjoyable the product is to use. A positive user experience is vital for driving adoption. When users find the product intuitive and satisfying, they are more likely to continue using it and recommend it to others. Businesses must prioritize user-friendly design and continually gather feedback to enhance the experience. A seamless user experience contributes significantly to higher adoption rates and long-term success.
Support and resources
Support and resources encompass the assistance and information provided to new users. Offering accessible resources such as guides, FAQs, and customer support increases user confidence and satisfaction. When users feel supported and can easily find help, they are more likely to adopt and continue using the product. Robust support systems not only improve adoption rates but also foster user loyalty.
Adoption rate vs. penetration rate
Adoption rate and penetration rate are both important ways to understand how people use a product or service, but they look at different things.
- Adoption rate measures how fast new users start using a product after it is launched
- Penetration rate shows how many potential users are currently using the product
Knowing these differences helps businesses improve their plans for growth and how they reach customers.
Let’s look closer at the key differences between these two terms.
| Adoption rate | Penetration rate | |
| Definition | Measures how many new users start using a product or service within a specific time after it is launched. | Measures how many people in a target market are using a product or service at a certain time. |
| Focus | New users and how fast they start using a product or service after it becomes available. | The overall market and how many people are using the product compared to all possible users. |
| Techniques | Companies track the number of new sign-ups, downloads, or purchases over a certain time. They can also use surveys and feedback to find out why some people do not adopt the product. | Involves market research to find out how many potential users there are and tracking sales data to see how many people are currently using the product. |
| Goals | Increase the number of new users quickly and help them start using the product or service effectively. | Increase the overall market share and ensure that more people in the target group are using the product. |
| Examples of use | A new app looks at how many people downloaded it in the first month after it launched. The information helps the company see early interest and engagement. | A smartphone brand figures out its penetration rate by checking how many people in a country use its phones compared to the total population. The data helps the brand understand its market presence. |
Use cases for adoption rate
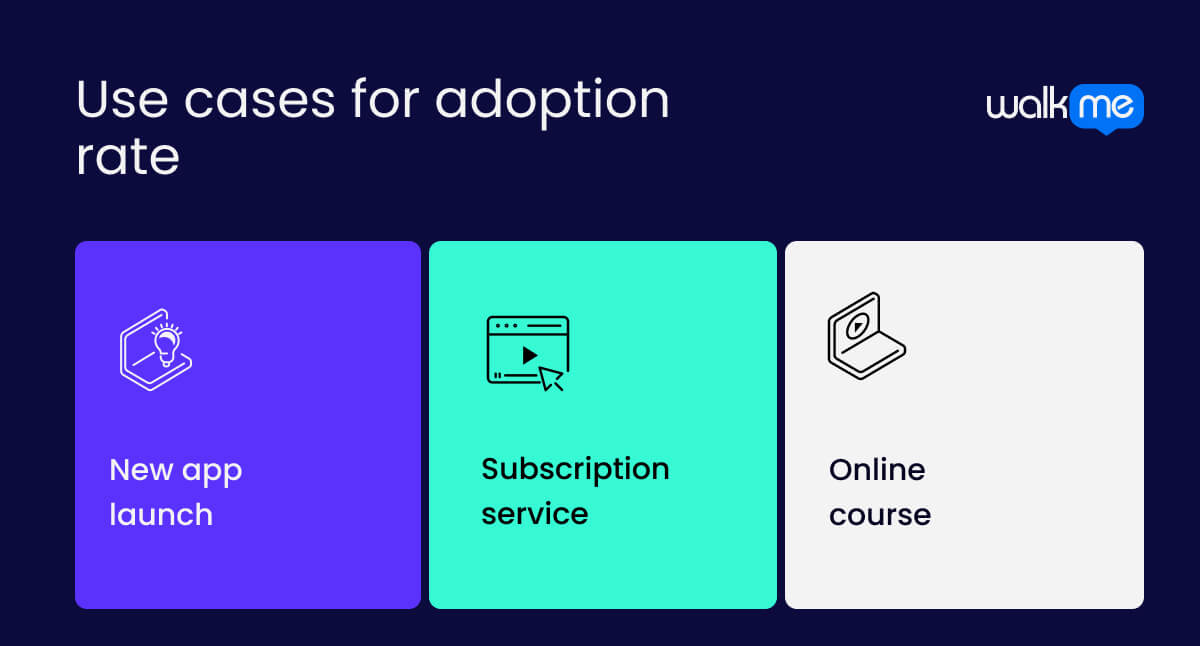
Adoption rates appear in different business situations in unique ways. Whether a new app is gaining users, a subscription service is gaining customers, or an online course is enrolling students, tracking adoption helps businesses see how interested users are.
Understanding how adoption rates show up in these cases can be helpful. Here are three examples to show how it works in different business settings.
New app launch
When a company launches a new app, it tracks the adoption rate to see how many people download and start using it within the first month. The system collects data on downloads and user sign-ups automatically.
Understanding early interest in the app helps the company see whether users find it valuable. Knowing the adoption rate allows the team to make quick decisions about marketing strategies or features to improve. They can focus on getting users more engaged instead of guessing what might work.
Subscription service
For a new subscription service, the business tracks the number of people who sign up during the first three months after launching. The system gathers data on new subscribers automatically each week.
Analyzing this information shows how well the service is attracting new customers. A higher adoption rate means the service is appealing, while a lower rate might mean that changes are needed. With this data, the team can quickly adjust pricing or promotional offers to boost subscriptions.
Online course
When an online learning platform offers a new course, it measures the adoption rate by counting the number of students who enroll in the first month. The system collects enrollment data automatically from the website. Studying the adoption rate helps the platform understand the course’s popularity and how well it meets student needs. If the adoption rate is low, the team can improve the course content or promote it more effectively, allowing them to respond quickly to boost student interest.
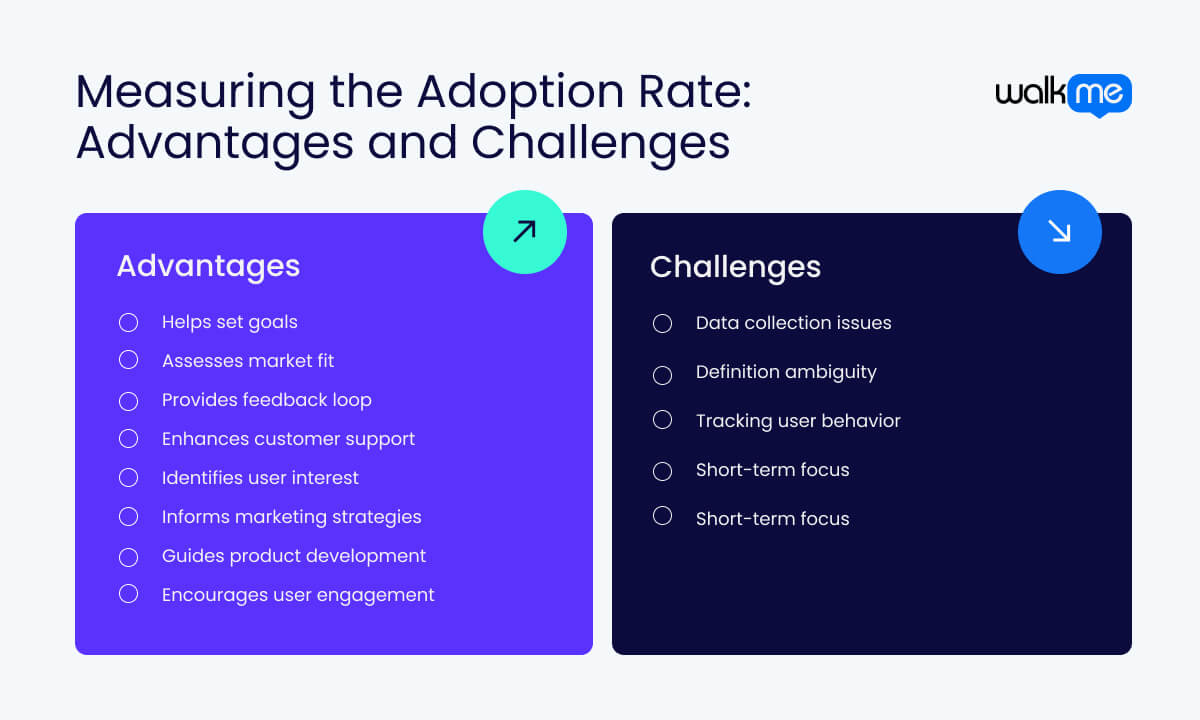
What are the benefits of measuring the adoption rate?
Measuring the adoption rate brings many benefits for businesses. By tracking how many users start using a product or service, companies can learn valuable information about user interest and engagement.
Understanding adoption helps organizations make better choices about marketing, product development, and customer support. These benefits can lead to happier customers and overall growth.
Let’s look at the main advantages of measuring the adoption rate in more detail.
Helps set goals
Businesses can set clear and realistic goals for growth. Knowing how many users start using a product helps teams create targets to aim for. Having specific goals can motivate workers and keep everyone on the same page.
Assesses market fit
It helps companies see how well their product fits in the market. If many users start using the product quickly, it means the product meets a real need. If adoption is slow, it may mean changes are needed to better fit what customers want.
Provides feedback loop
Measuring the adoption rate provides businesses with feedback. As they gather information about how users adopt the product, they can learn what works and what doesn’t. Ongoing feedback helps them improve their products and stay relevant.
Enhances customer support
Understanding this metric helps businesses improve their customer support. If many users have trouble using the product, the company can offer better resources, like guides or help centers. Good support makes it easier for new users to understand and enjoy the product, leading to happier customers.
Identifies user interest
Companies can see how many people are interested in a new product or service. By understanding user interest, companies can make better choices about marketing and improvements. The information collected helps them create features that meet what users need.
Informs marketing strategies
Keeping track of adoption shows which marketing strategies are working best. Businesses can learn which promotions attract new users and change their plans based on that. This way, they can spend their marketing money more wisely to reach more potential customers.
Guides product development
Having such information available helps organizations see how well their products are accepted. If the rate is low, businesses can find out why and make changes. Better understanding leads to improved products that meet users’ expectations and encourage more people to join.
Encourages user engagement
It shows how well businesses are engaging new users. If the rate is low, they can take steps to improve the user experience, making it easier and more enjoyable for people to use their products. These efforts can lead to happier users who stay longer.
What are the challenges of measuring the adoption rate?
Businesses want to know how many users are engaging with their products and services. However, measuring this can bring its own set of problems that need to be fixed.
Understanding these challenges is important for getting accurate data and making smart choices.
Data collection issues
Collecting accurate data on user adoption can be challenging. Some users might not sign up or provide the right information, leading to missing data. Without good data, it is hard to know the real adoption rate.
Definition ambiguity
Businesses can have different ideas about what “adoption” means. Some may think it means just signing up, while others want to see people using the product regularly. Confusion about the definition can make it hard to measure adoption the same way for different products.
Tracking user behavior
It can be tricky to follow how users use a product. Some users might use different devices or switch between platforms, which makes it hard to see how much they are using it. Not knowing how users behave makes it tough to measure adoption.
Short-term focus
Some businesses might focus too much on short-term numbers instead of how users stay over time. Making choices based on quick increases can lead to problems later, and paying too much attention to quick results can hide bigger issues with keeping users happy.
How can DAPs help with adoption rates?
Digital adoption platforms (DAPs) are very helpful for businesses looking to boost adoption rates. When a company uses a DAP, it can make it easier for users to learn how to use new products and services. These platforms provide features that guide users step-by-step, helping them understand and engage with the technology. Let’s look at how DAPs help improve adoption rates and make the user experience better in different business situations.
User guidance
Clear user guidance is provided to help people learn how to use a product well. On-screen tips, prompts, and tutorials tell users exactly what to do next. By breaking down difficult tasks into simple steps, DAPs make it easier for users to move around the product.
Support like this helps build confidence and encourages users to try more features. When users feel helped, they are more likely to adopt the product and use it often.
Progress tracking
Tracking user progress as they use a product is an essential feature that collects important data on how users engage with different features. This information helps businesses see which parts of the product are used the most and where users might have problems.
Finding specific areas where users stop using the product or struggle allows companies to make helpful improvements. They can also provide support or resources to help users overcome these challenges. Getting the help they need increases the chances that users will adopt the product.
Personalized experiences
Personalized experiences are created for users based on their actions, preferences, and needs. By looking at how users interact with the product, DAPs can tailor messages, tips, and resources for each person. Customizing experiences like this makes learning more relevant and fun.
For example, a new user might get different help than a more experienced user. When users feel that the product fits their needs, they are more likely to adopt it and use it regularly.
Feedback collection
Collecting feedback from users about their experience gives them a way to share their thoughts and suggestions. Feedback can show what users like and dislike about the product and any problems they face. By listening to user input, businesses can make changes that improve the product. When users see their feedback lead to changes, they feel valued and are more likely to adopt the product for the long term.