What is behavioral data?

Table of contents
Behavioral data shows how people act and interact, often online. It helps organizations to understand how users engage with products, services, websites, and apps. This data also includes information about what people buy. Companies learn about their subscriptions and other financial activities. This helps them understand what encourages people to make a purchase. It can be used by businesses to personalize experiences. They can build on the data to improve user interfaces and create targeted marketing campaigns. Overall, they can develop better products and predict future behaviors and trends. In short, behavioral data gives a detailed and real-time understanding of user behavior. This makes it a valuable tool for improving user engagement and satisfaction. Why is now the time to think about using behavioral data smartly?
- Only 44% of data and analytics leaders reported that their team is proving effective in providing value to the company
- Real-time data analytics is profitable. 80% of companies surveyed across six countries reported a revenue uplift as a result of using it
What are the key components of behavioral data?
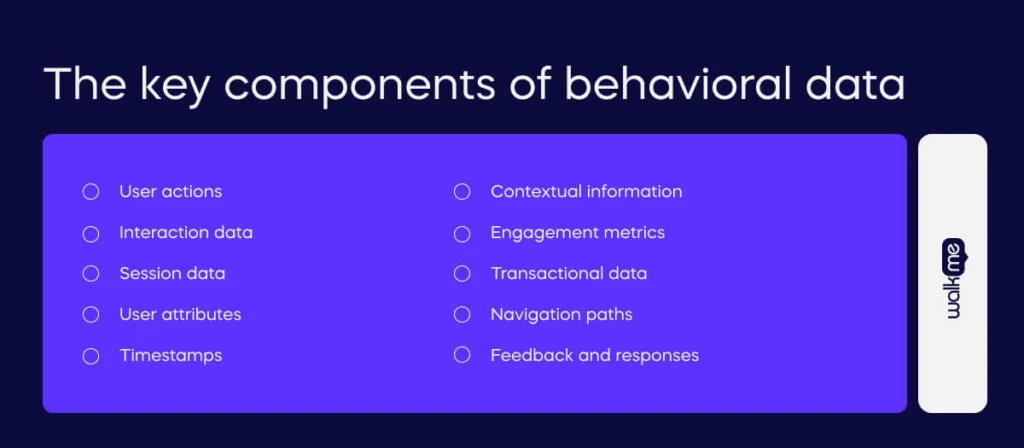
Monitoring behavioral data effectively involves looking at many different types of measurement. It is important to understand what people do, how long they spend doing it, what devices they use, and much more. While these measures can be interesting on their own, they are more useful when combined. From there, companies can understand their customers better. They can develop a better product and a higher-quality user experience. Here are the most common and important components to consider when monitoring behavioral data:
User actions
User actions are what users do, like clicking, viewing pages, filling out forms, playing videos, and buying things. These actions show how users interact with a website or app.
Interaction data
Interaction data includes how users engage with different parts of a page or app. Examples are hovering over items, scrolling, clicking buttons, and navigating. This data helps understand user engagement.
Session data
Session data covers a user’s visit, such as how long they stay, which pages they visit, and the order of their actions. This helps analyze user journeys and find common paths or when users leave.
User attributes
User attributes are details about the user, such as age, gender, location, device type, operating system, and browser. These details help group users and understand different behaviors.
Timestamps
Timestamps show when each action happens. This helps to see patterns over time, like peak usage times and how long users take to complete actions.
Contextual information
Contextual information includes data about the user’s environment, such as location, IP address, and network type. This helps to understand external factors that might affect user behavior.
Engagement metrics
Engagement metrics are measures of user involvement, like click-through rates, bounce rates, conversion rates, and time spent on the site. These metrics show how well a website or app keeps and satisfies users.
Transactional data
Transactional data includes records of money-related actions, like purchases, subscriptions, and refunds. This data is important for understanding user spending behavior and financial impact.
Navigation paths
Navigation paths are the routes users take through a website or app. They show the sequence of pages or screens visited. This helps to see how users explore and navigate the site or app.
Feedback and responses
Feedback and responses include any direct input from users, like ratings, reviews, comments, and survey answers. This provides valuable insights that go with the numbers from behavioral data.
Behavioral data vs declarative data
Behavioral data and declarative data may seem like similar or identical concepts, but there are some differences to be aware of.
- Behavioral data shows what users do online
- Declarative data is what users provide about themselves
Understanding these differences helps businesses personalize experiences and target marketing better. Here’s a more in-depth look:
| Behavioral data | Declarative data | |
| Definition | Shows what users do on websites and apps. It tracks their actions and interactions. | Shows what users say about themselves. It includes their preferences and personal details. |
| Focus | What users actually do. | What users say about themselves. |
| Techniques | Collected through tools like cookies and analytics software. It records clicks, page views, and how long users stay on a site. | Collected through surveys, forms, and user profiles. It asks users for their age, gender, interests, and opinions. |
| Goals | Aims to understand user actions, improve user experience, and improve websites and apps. It helps predict what users will do next. | Aims to understand user likes and dislikes and who they are. It helps personalize content and target marketing. |
| Examples of use | E-commerce: Seeing what products users view and buy to recommend similar items.Websites: Tracking which pages are visited most to improve content.Apps: Monitoring which features are used most to make them better. | Marketing: Using survey answers to create targeted ads.Content personalization: Showing content based on user-stated interests.Customer service: Using profile information to give personalized help. |
Use cases for behavioral data
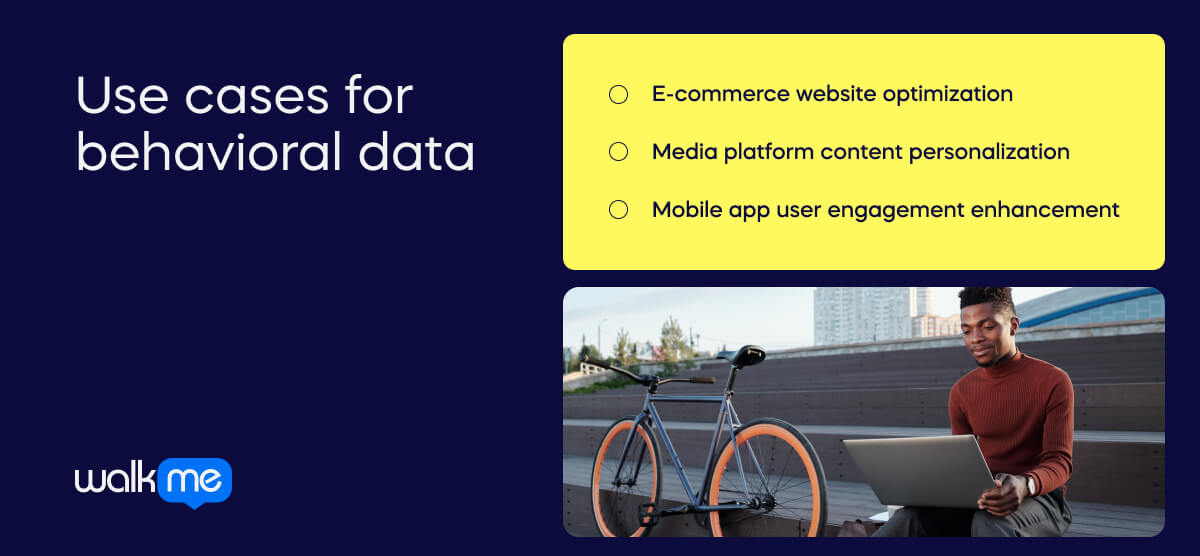
It is important to understand how behavioral data works in different business situations. It helps businesses like online stores, media websites, and mobile apps do better. Let’s examine three examples to see how behavioral data helps in real business situations.
E-commerce website optimization
- In e-commerce, behavioral data shows what users look at, click on, and buy.
- By checking this data, businesses can see which products are popular and where users have problems during checkout.
- For example, if many users leave before buying, businesses can fix those problems to sell more.
Media platform content personalization
- In media platforms, behavioral data shows what users like to read, watch, or listen to.
- By looking at this data, platforms can show users more of what they like, keeping them interested.
- For example, if many users read articles about sports, platforms can show more sports news on their homepage.
Mobile app user engagement enhancement
- In mobile apps, behavioral data shows how users use different parts of the app.
- By checking this data, developers can see what users like and improve those parts.
- For example, if many users spend a lot of time on a game section, developers can add more games to keep them playing.
It is important to understand how behavioral data works in different business situations. It helps businesses like online stores, media websites, and mobile apps do better. Let’s examine three examples to see how behavioral data helps in real business situations.
What are the advantages of behavioral data?
Behavioral data offers many advantages for businesses.
Companies can gain valuable insights and make better decisions by focusing on how users behave. This leads to improved customer satisfaction, more effective marketing, and smarter product development.
Let’s look in more detail at all the benefits of using behavioral data.
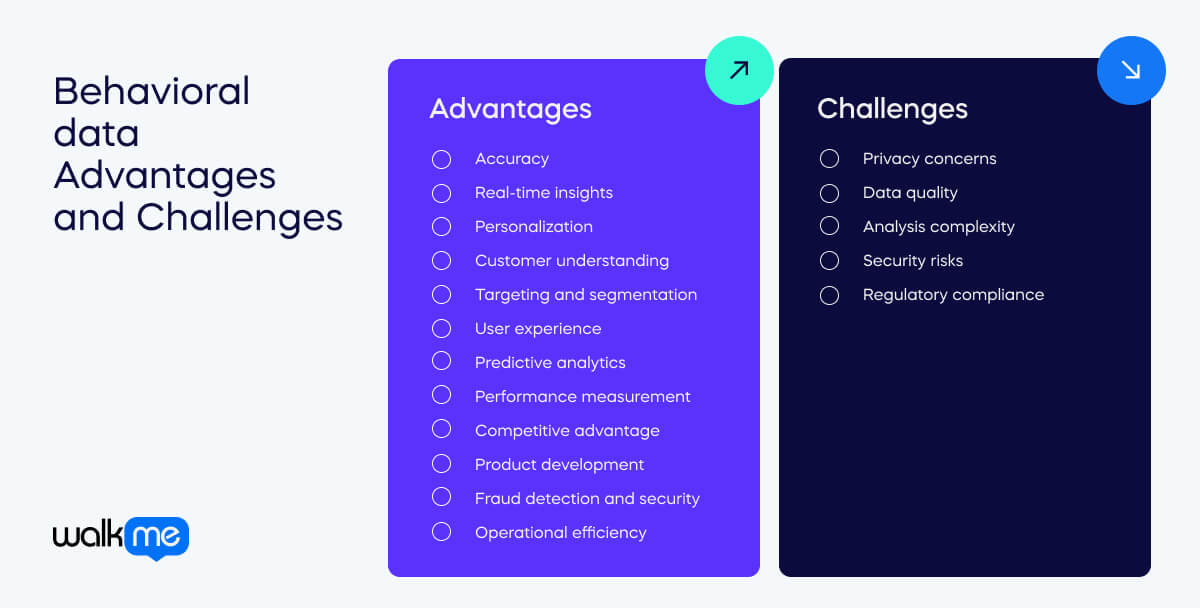
Accuracy
It shows what people actually do, not what they say they do. This makes it more accurate.
Real-time insights
Data is often collected instantly, helping organizations make quick decisions.
Personalization
Companies can offer personalized content and services based on user behavior.
Customer understanding
It helps businesses understand what customers like and need.
Targeting and segmentation
Companies can target their marketing efforts more precisely.
User experience
By analyzing behavior, businesses can make products easier to use.
Predictive analytics
Behavioral data can predict future trends and customer actions.
Performance measurement
Companies can see how well their strategies and products are working.
Competitive advantage
Using this data helps companies stay ahead of competitors.
Product development
Insights guide the development of products that meet user needs.
Fraud detection and security
It helps find unusual patterns that might indicate fraud.
Operational efficiency
Understanding how resources are used helps improve efficiency.
What are the challenges of behavioral data?
Studying behavioral data provides many important clues about what people like and do. However, it also has a few difficulties.
Let’s talk about the problems companies can face when trying to understand and use this data.
Privacy concerns
Collecting data can make users feel uneasy or mistrustful.
Data quality
The data can be messy and hard to keep accurate.
Analysis complexity
Understanding the data often needs special skills and tools.
Security risks
Keeping the data safe from theft or leaks is challenging.
Regulatory compliance
Following laws about data use can be hard and takes time.
How can DAPs help with behavioral data?
Understanding user behavior is key for businesses wanting to optimize their product or service.
Fortunately, digital adoption platforms (DAPs) have many features to help companies understand how users interact with them online.
Let’s examine how DAPs can harness this data to find patterns, personalize experiences, and ultimately improve performance.
User behavior tracking
DAPs often include features that can track users’ online activities. By monitoring information about where they click and what they look at, these platforms gather useful data about how people use the product or service.
| How can WalkMe help? Insights Sessions: Companies can record user sessions to see exactly what users click on, what pages they visit, and how they interact with the platform. Element tracking: With WalkMe, tracking specific elements within the platform is easy. Examples include buttons, menus, or forms. Organizations can then see how often they’re used and identify potential issues. Insight Funnels: People can track user flow to identify drop-off points and optimize the user experience. |
Segmentation and personalization
DAPs can segment users and create personalized experiences. Businesses can then create tailored options online to match specific user needs.
| How can WalkMe help? User segments: WalkMe lets companies segment users based on their behavior, demographics, or other criteria. Targeted Walk-Thrus: Smart Walk-Thrus can be targeted, so they are only shown to specific user segments. Dynamic content: Companies can build personalized content into their Smart Walk-Thrus based on user data, like their name or company. |
Performance monitoring
Businesses can assess how well people are doing online in real-time. They can use a data-driven approach to determine whether their digital tools are working well or if they need to make changes to drive better outcomes.
| How can WalkMe help? WalkMe Insights: This powerful feature lets companies track user engagement metrics. They can look at completion rates and time spent on Smart Walk-Thrus to measure the effectiveness of their digital adoption strategy. Custom goals: Companies can set custom goals for their Walk-Thrus. This could be completing a specific task or reaching a certain page. They can use this data to track user progress. |
Success stories with behavioral data
Using behavioral data is a powerful way to improve processes.
Many companies have reaped the rewards by onboarding WalkMe’s analytics tools alongside the DAP.
Here’s an example:
Origin x WalkMe
Origin handled 7,000 support tickets a month. They had to walk employees through solutions manually, which took up a lot of time.
They brought in WalkMe to help optimize processes and save money. With Smart Walk-Thrus, they turned common workflows into WalkMe journeys.
Using behavioral data from WalkMe Insights, the company could rework processes to optimize the way people work and avoid any issues.
The organization continues to use Insights to analyze drop-off rates and flag issues for maintenance and improvement.
As a result, support tickets have been reduced by 70%, and knowledge article visits have increased by 30x per month.