What are customer journey analytics?
Customer journey analytics tracks and studies how customers interact with a brand. It looks at every step a customer takes, from first contact to final purchase.

Table of contents
Advanced data analysis lets businesses explore their sales. They can look at performance trends, customer behaviors, and market dynamics. This involves collecting data from various sources, such as sales transactions, customer interactions, and marketing campaigns, and using tools to identify patterns and correlations. The main goal is to give organizations actionable intelligence, which will help them improve sales by being more effective and efficient. Sales analytics insights can help businesses identify growth opportunities, optimize pricing strategies, enhance customer segmentation, and forecast future sales trends. Ultimately, it enables data-driven decisions that boost revenue, improve customer satisfaction, and maintain market competitiveness. Effective analytics leveraging is crucial. For example, Gartner’s research reveals that barriers to analytics success include poor data quality and limited cross-functional collaboration.

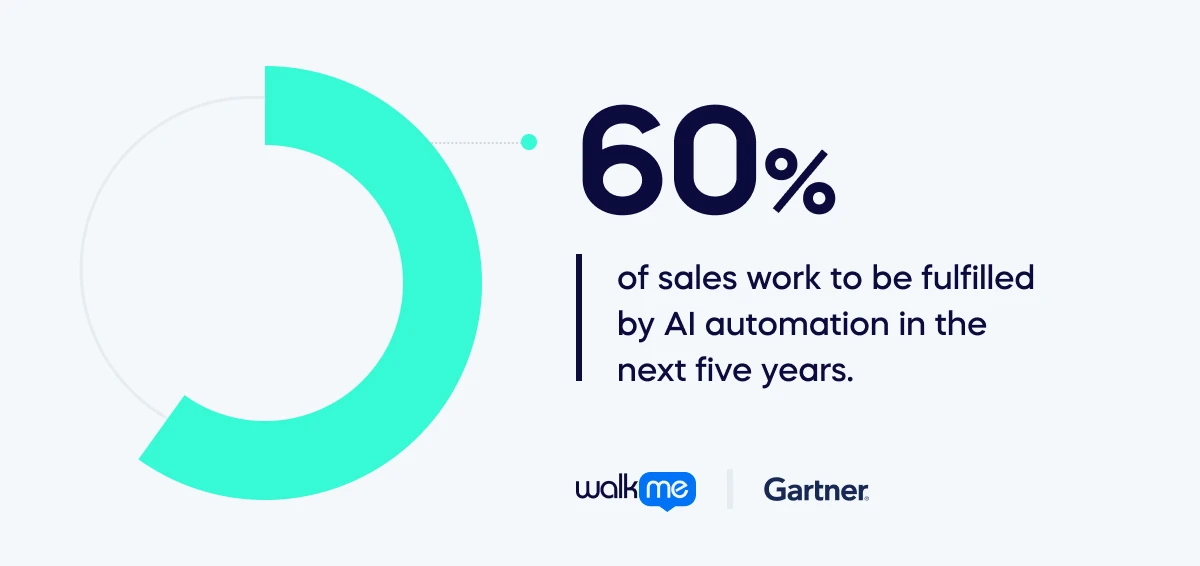
That said, the field is growing – Gartner expects 60% of sales work to be fulfilled by AI automation in the next five years.
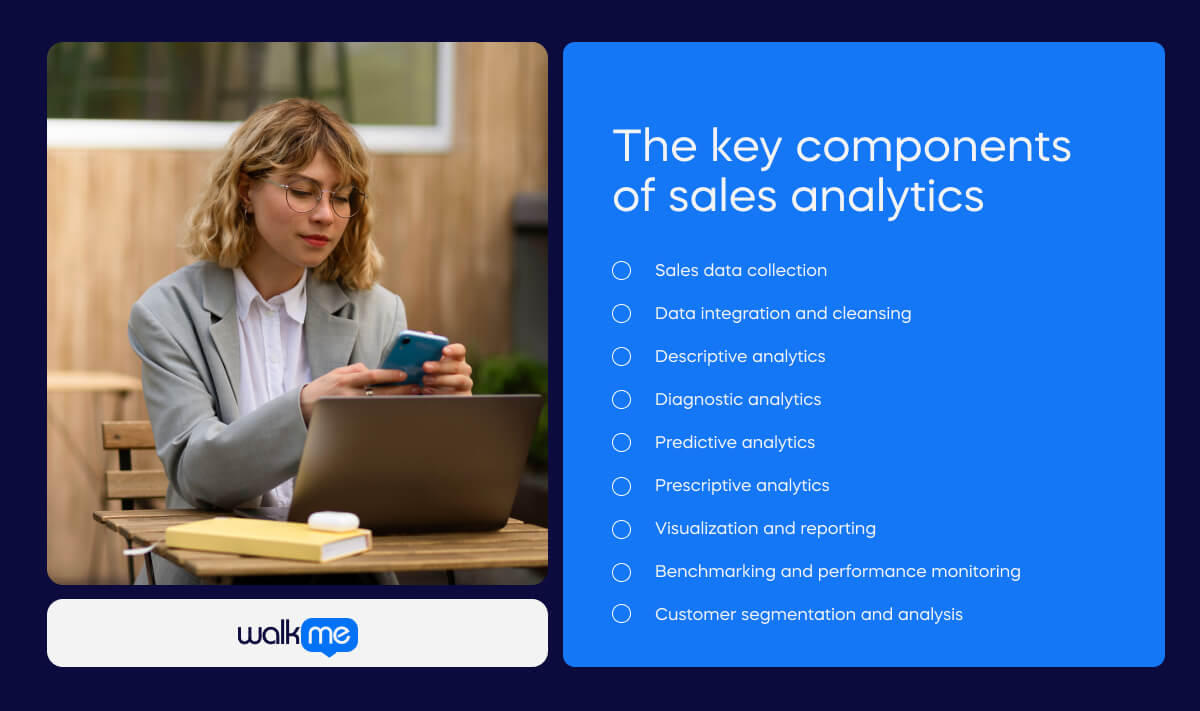
What are the key components of sales analytics?

Sales analytics typically involves several key components essential for analyzing and understanding sales performance and trends. By leveraging them, businesses can gain deeper insights into their sales operations, optimize strategies, improve decision-making, and drive revenue growth. These components include:
Sales data collection
Gathering comprehensive data on sales transactions, customer interactions, leads, opportunities, and other relevant metrics. This data often comes from CRM systems, point-of-sale (POS) systems, marketing automation platforms, and other sources.
Data integration and cleansing
Integrating data from various sources into a unified platform and ensuring accuracy and consistency through data cleansing processes. This step is crucial to eliminating duplicates, errors, and inconsistencies that skew analysis results.
Descriptive analytics
Using descriptive statistics and techniques to summarize and describe historical sales data. This includes metrics such as sales volume, revenue, average deal size, conversion rates, and sales pipeline stages.
Diagnostic analytics
Analyzing data to identify causes and factors contributing to sales performance outcomes. This involves identifying patterns, correlations, and trends within the data to understand why certain sales outcomes occurred.
Predictive analytics
Forecasting future sales trends and outcomes based on historical data and predictive modeling techniques. Predictive analytics helps businesses anticipate demand, identify potential opportunities, and optimize sales strategies accordingly.
Prescriptive analytics
Providing actionable insights and recommendations for improving sales performance. Prescriptive analytics goes beyond predicting outcomes. It suggests actions to achieve desired sales goals.
Visualization and reporting
Presenting sales data and insights in a visual format through dashboards, reports, and interactive visualizations. This makes complex data easier to understand and enables stakeholders to make informed decisions quickly.
Benchmarking and performance monitoring
Comparing current sales performance against past performance, industry benchmarks, and competitors. This helps businesses track progress, identify areas for improvement, and set realistic sales targets.
Customer segmentation and analysis
Segmenting customers based on demographics, behavior, buying patterns, and other criteria. This helps with tailoring sales strategies and marketing efforts more effectively.
Sales analytics vs. sales metrics
Sales analytics and sales metrics serve complementary roles in sales performance management. Both are essential for guiding strategic and tactical decisions, improving efficiency, and achieving organizational sales goals. However, they are not the same.
- Sales metrics provide specific quantitative measures to track performance
- Sales analytics uses advanced techniques. It derives deeper insights and predictions from sales data.
Take a look at our comparison to dig deeper.
| Sales analytics | Sales metrics | |
| Definition | The systematic analysis of sales data to uncover insights, patterns, and trends that inform strategic business decisions aimed at improving sales performance and effectiveness. | Specific quantitative measures are used to track and assess various aspects of sales performance and activities within an organization. |
| Focus | To understand the underlying factors influencing sales outcomes through advanced data analysis techniques. It looks beyond surface-level metrics to uncover correlations, causations, and predictive insights. | Quantifying specific aspects of sales performance, such as sales volume, revenue generated, average deal size, conversion rates, and sales pipeline metrics. They provide a snapshot of performance at a given point in time. |
| Techniques | Data mining Statistical analysis Predictive modeling Machine learning Data visualization | Collecting and reporting numerical data from operational systems like CRM platforms, sales reports, and financial records. These metrics are often tracked over time to monitor trends and performance indicators. |
| Goals | Drive strategic decision-making Improve sales forecasting accuracy Optimize sales processes Enhance customer segmentation Increase revenue and profitability | Monitor performance Measure progress toward sales targets Identify strengths and weaknesses in sales processes Provide insights for tactical decision-making |
| Examples of use | Analyzing historical sales data to identify seasonal trends and patterns. Using predictive analytics to forecast future sales volumes and revenue. Implementing customer segmentation analysis to personalize sales and marketing strategies based on customer behavior and preferences. | Tracking monthly sales revenue to assess financial performance. Monitoring conversion rates to evaluate the effectiveness of sales efforts. Calculating average order value (AOV) to understand purchasing patterns and custom |
Use cases for sales analytics
Sales analytics is crucial in many business scenarios. It helps organizations improve strategies and performance. It provides crucial insights, whether analyzing customer behaviors for better marketing, tracking sales across regions for resource allocation, or forecasting market trends for seizing opportunities. Here are three examples to help visualize how sales analytics appears in companies. They show their power in driving strategy.
Forecasting sales trends
- A retail company wants to predict sales trends for the upcoming holiday season.
- The company uses past sales data and demographic trends, as well as external factors (e.g., economic conditions, competitor activities), to build predictive models.
- These models forecast sales volumes. They also identify peak periods and predict demand for specific products.
- This allows the company to optimize inventory levels, plan marketing well, and allocate resources efficiently. The company can then use the resources to capitalize on expected sales.
Customer segmentation and personalization
- The platform’s goal is to keep customers and boost sales. It aims to do this with targeted marketing.
- The platform analyzes customer data, such as purchase history, browsing behavior, and demographics, and uses it to segment customers into groups based on their preferences and buying behaviors.
- Sales analytics identifies high-value customer segments, understanding what drives their purchasing decisions.
- The platform can use these insights. It can personalize marketing messages. It recommends relevant products and tailors offers to different customer segments.
- This approach enhances customer engagement, increases conversion rates, and boosts overall sales revenue.
Optimizing sales performance
- The company sells software to other businesses. It wants to improve the performance of its sales team and increase sales.
- The company uses sales analytics to evaluate its sales process at each stage of the sales funnel.
- The company analyzes conversion rates, sales cycle lengths, win rates, and deal sizes. This helps it identify bottlenecks and areas for improvement.
- Sales analytics helps assess the performance of individual sales reps. It identifies top performers and the strategies that lead to their success.
- With these insights, the company can conduct targeted sales training, refine sales and pricing strategies, and allocate resources more effectively, which will drive higher sales and revenue.

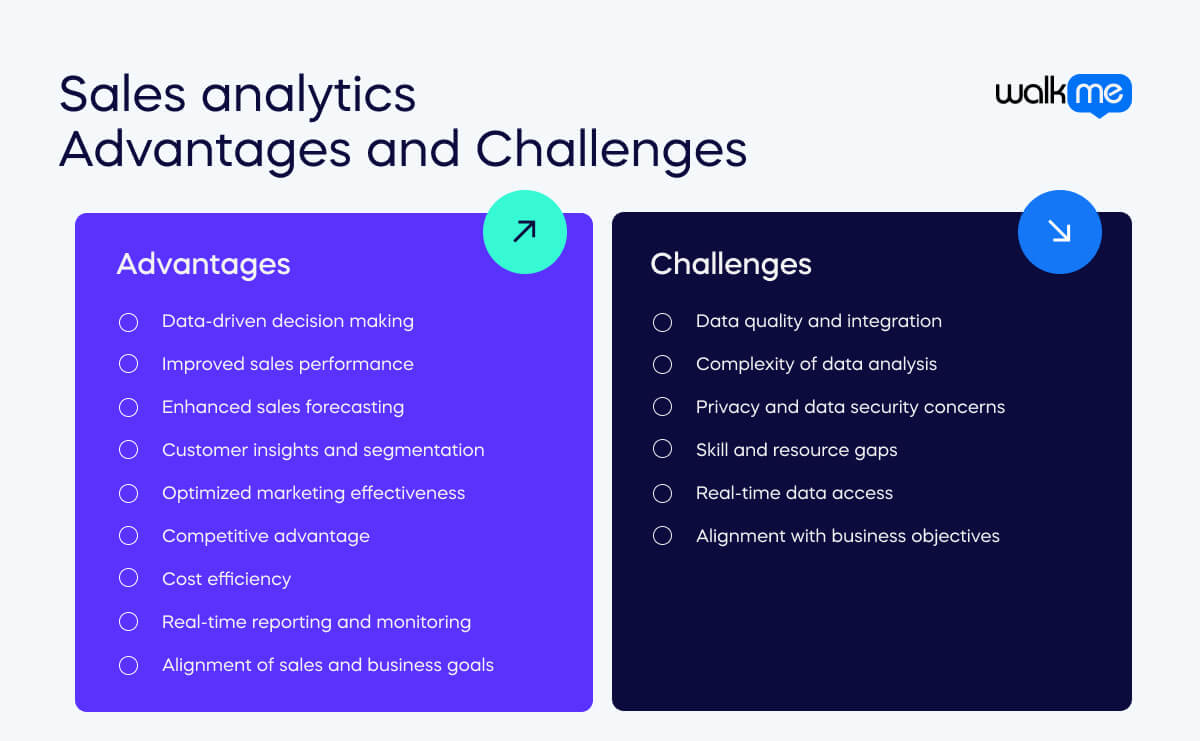
What are the advantages of sales analytics?
Sales analytics has several benefits. They improve sales, decisions, and growth. It empowers businesses with the insights they need. These insights optimize sales, improve customer engagement, boost profits, and keep a business competitive. Here are the key advantages of implementing sales analytics:
Data-driven decision making
Sales analytics provides businesses with actionable insights derived from comprehensive data analysis. This enables informed decision-making based on empirical evidence rather than intuition or guesswork.
Improved sales performance
By analyzing sales data, businesses can find trends, patterns, and factors that influence sales outcomes. This insight allows them to optimize sales strategies and improve sales processes. It also lets them focus on activities that yield the highest returns.
Enhanced sales forecasting
Sales analytics enables accurate forecasting of future sales trends and demand patterns. This helps businesses predict market changes, plan inventory levels, and shift resources as needed.
Customer insights and segmentation
Studying customer data with sales analytics helps businesses understand customer behavior. They learn about preferences and buying patterns. This enables personalized marketing strategies, targeted sales campaigns, and improved customer relationship management.
Optimized marketing effectiveness
Sales analytics provides insights into the effectiveness of marketing campaigns and initiatives. By measuring ROI and analyzing customer response rates, businesses can improve their marketing strategies, spend budgets more effectively, and maximize marketing.
Competitive advantage
Businesses that leverage sales analytics effectively gain a competitive edge. They can quickly adapt to market changes, identify new opportunities, and respond to competitive threats based on data-driven insights.
Cost efficiency
Sales analytics helps identify inefficiencies in sales processes and resource utilization. By streamlining operations, businesses can cut costs and boost profits, allowing them to focus on high-value activities.
Real-time reporting and monitoring
Sales analytics tools let businesses access real-time dashboards and reports, providing up-to-date data on sales performance. This facilitates proactive decision-making and enables timely adjustments to sales strategies.
Alignment of sales and business goals
Sales analytics helps in aligning sales efforts with broader business goals and objectives. It clarifies key performance indicators (KPIs), benchmarks performance against targets, and ensures that sales activities contribute effectively to organizational success.
What are the challenges of sales analytics?
Sales analytics is highly beneficial. But, it also comes with several challenges that organizations may face. These challenges can impact the effectiveness and implementation of sales analytics initiatives. Addressing these challenges requires a strategic approach, commitment to data quality and security, investment in technology and talent, and strong leadership support. Overcoming these hurdles can help organizations fully use sales analytics, which can drive business growth and competitive advantage. Here are some common challenges:
Data quality and integration
One of the primary challenges is ensuring the quality and reliability of sales data. Data may be incomplete, inconsistent, or spread across disparate systems, making integration and normalization complex. Poor data quality can lead to inaccurate analysis and flawed insights.
Complexity of data analysis
Sales data sets can be vast and complex, containing numerous variables and factors. Analyzing this data requires advanced analytical skills, tools, and expertise. Organizations may struggle with selecting appropriate analytical techniques and interpreting results correctly.
Privacy and data security concerns
Handling sensitive customer and sales data raises privacy concerns and concerns about following data protection regulations (e.g., GDPR, CCPA). Organizations must ensure data confidentiality, integrity, and secure handling throughout the analytics process.
Skill and resource gaps
Good sales analytics needs skilled data analysts, data scientists, and IT pros. They must understand sales and analytics. Recruiting and retaining talent with these specialized skills can be challenging for some organizations.
Real-time data access
The timeliness of data access is crucial for making informed decisions. Delays in data availability or processing can hinder the ability to respond quickly to market changes and customer needs.
Alignment with business objectives
Sales analytics efforts must align closely with business goals and strategies. Lack of alignment can lead to misdirected efforts, irrelevant insights, and an inability to translate analytics findings into actionable outcomes.
How can DAPs help with sales analytics?
Digital adoption platforms (DAPs) can significantly enhance sales analytics by facilitating the adoption and effective use of digital tools and platforms within organizations. Digital adoption platforms are crucial. They support sales analytics initiatives by ensuring effective tool use. They also improve user skills, provide real-time support, and enable continuous improvement. By enhancing the usability and utilization of sales analytics tools, DAPs contribute to maximizing the effectiveness of sales teams and driving better business outcomes. Here are several ways DAPs can help with sales analytics:
User onboarding and training
DAPs simplify onboarding for new sales tools and analytics platforms. They provide guided walkthroughs, tutorials, and interactive training. These resources help sales teams quickly understand how to use analytics tools well. They speed up user adoption and cut the learning curve.
Feature adoption and utilization
Continuous guidance from DAPs assists users in leveraging the full capabilities of sales analytics tools. Contextual guidance and in-app prompts highlight key features, shortcuts, and best practices, encouraging comprehensive utilization of analytics functionalities. This ensures that teams maximize the value of their tools.
Real-time support and assistance
Within analytics applications, users benefit from contextual help and support. They can access tooltips, help articles, and troubleshooting guides without leaving the platform. This approach reduces downtime, improves productivity, and empowers users to resolve issues independently.
Performance tracking and insights
DAPs collect usage data and analytics. They show how sales teams use digital tools. They provide insights into feature use rates, time on tasks, and completion rates of guided workflows. Analyzing this data offers insights into user behavior, areas of proficiency, and potential improvements.
Personalized recommendations
DAPs use user interactions and analytics to deliver personalized recommendations that optimize workflows and improve user efficiency. For example, they may suggest advanced analytics features based on a user’s skill level or recommend training modules to enhance skills.
Change management and updates
DAPs are crucial in managing changes and updates to sales analytics tools. They send targeted messages and notifications to users about new features, updates, and workflow changes. This ensures that sales teams stay informed and can quickly adapt, maintaining productivity and proficiency.
Integration with CRM and other systems
Many DAPs seamlessly integrate with CRM systems and other sales analytics platforms. This integration provides a holistic view of sales data and user interactions across different tools. It facilitates data exchange, enhances data integrity, and supports comprehensive analysis and reporting.